About Circle Graph Formula
A circle graph is the intersection graph of a set of circle chords in graph theory. It's an undirected graph whose vertices can be linked-to circle chords, with two vertices being adjacent if and only if the corresponding chords cross. A pie graph or pie chart is another name for a circle graph.
The following are some essential circle graph formulas:
- Percentages = (Amount in the Category ⁄ Total) × 100
- Angle = (Amount in the Category ⁄ Total) × 360°
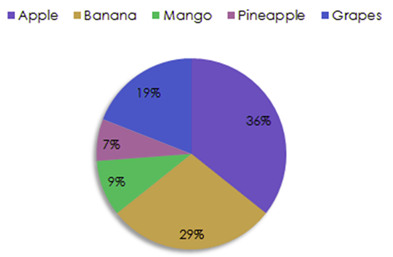
Example: 36 percent apples, 29 percent bananas, 9 percent mangoes, 7 percent pineapples, and 19 percent grapes make up a fruit basket. Make a circle graph chart using the information supplied.
- Sol:Given that,
- Apples – 36%
- Bananas –29%
- Mangoes –9%
- Pineapples –7%
- Grapes –19%
With the above data, the circle graph will be drawn as:
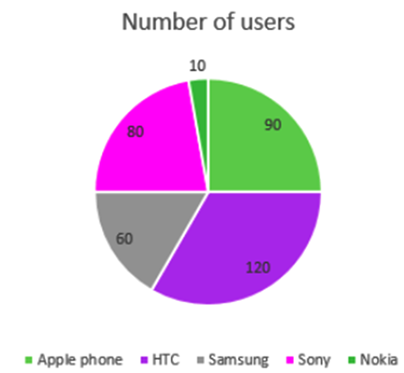
Example: The following information reveals the number of distinct mobile phones utilised by employees in one company department. Using angle proportions, create a circle chart with the following data.
| Mobile phone | Number of users |
| Apple phone | 9 |
| HTC | 12 |
| Samsung | 6 |
| Sony | 8 |
| Nokia | 1 |
Sol:Angle = (Amount in the Category ⁄ Total) × 360°
| Mobile phone | Number of users | Angle |
| Apple phone | 9 | (9/36) × 360° = 90° |
| HTC | 12 | (12/36) × 360° = 120° |
| Samsung | 6 | (6/36) × 360° = 60° |
| Sony | 8 | (8/36) × 360° = 80° |
| Nokia | 1 | (1/36) × 360° = 10° |
To get all the Maths formulas check out the main page.