About Venn Diagram Formula
Let us review what a Venn diagram is before understanding the Venn diagram formula. Venn diagrams are a visual depiction of sets in mathematics. A Venn diagram aids in the visualisation of the logical relationship between sets and their elements, as well as the solution of cases based on these sets. The relationship between sets is shown in a Venn diagram by intersecting and non-intersecting circles. Get the List of all Maths formulas in one place.
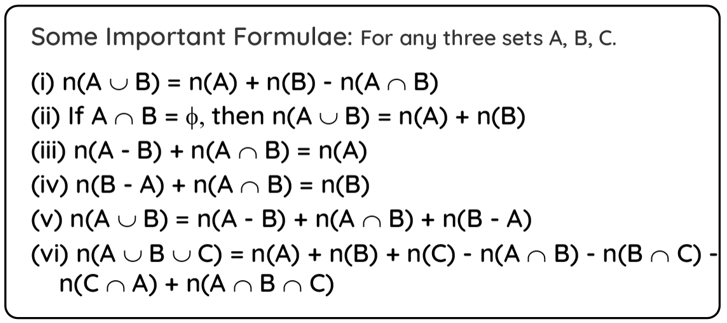
This is a fundamental set theory formula. The number of items in set A is represented by n(A). The formula for the Venn diagram shows the relationship between the number of elements in two sets. It is provided by:
n(A U B) = n(A) + n(B) – n (A ∩ B)
Here,
- n(A U B) represents the number of elements present in either one of the sets A or B
- n(A ∩ B) represents the number of elements present essentially in both sets A and B