Chapter-12. Human Resources
The chapter “Human Resources” emphasizes people as the most valuable asset of a nation. It explains how the population contributes to economic development and how education, health, and skills improve human capital. Students learn about population density, distribution, and migration patterns. With NCERT Solutions for Class 8, learners can easily understand concepts like workforce participation and population structure. Class 8 Notes provide concise explanations of human development indicators and how countries utilize their people’s potential. To strengthen understanding, Class 8 Home Tuition offers personalized sessions focusing on data interpretation, population graphs, and real-world applications. Tutors guide students in connecting population trends with national progress. Understanding this chapter builds awareness of how responsible citizens and skilled workers contribute to a nation’s growth.
Human Resources Introduction
People area nation’s greatest resource. A country may have abundant and varied natural resources such as minerals, water and fertile soil. But it needs people to utilise these resources. Nature's bounty becomes significant only when people when find it useful. It is people with their demands and abilities that turn them into ‘resources'.
People are, therefore considered to be the most important resource of a country. This resource is known as Human resource. The all-round development of a country depends not so much on the size of the population as on the skills, awareness, technical knowledge, health, etc., of the people.
Healthy, educated and motivated people develop resources as per their requirements. Human resources like other resources are not equally distributed over the world. They differ in their educational levels, age and sex. Their numbers and characteristics also keep changing.

Distribution of Population
- The way in which people are spread across the earth surface is known as the pattern of population distribution. More than 90 per cent of the world's population lives in about 10 percent of the land sarface. The distribution of population in the world is extremely uneven
- Some areas are very crowded and some are sparely populated. The crowded areas are south and south east Asia. Europe and north eastern North America. Very few people live in high latitudinal areas, tropical deserts, high mountains and areas of equatorial forests. Many more people live north of the Equator than south of the Equator. Almost three-quarters of the world's people live in two cntinents Asia and Africa.
- Sixty per cent of the world’s people stay in just 10 countries (Japan, Nigeria, Russia, Bangladesh, Pakistan, Brazil, Indonesia, USA, India and China). All of them have more than a 100 million people.
Density of Population
Population density is the number of people living in a unit area of the earth's surface. It is normally expressed as per square km. The average density of population in the whole world is 45 persons per square km.
Factors Which Affect Distribution of Population
Physical Factors:
- Landforms : Plains have the highest concentrations of population due to the flat topography, which is suitable for agriculture, industry and the development of transport facilities. Plateaus are less populated than plains. Mountains have the lowest concentrations of population.
- Climate : Regions having extermely hot or cold climate are thinly populated as are regions that do not receive much rainfall. Region with moderate climate and rainfall, like the region having monsoon climate, are heavily populated.
- Soil : Fertile soils provide suitable land for agriculture. Fertile plains such as Ganga and Brahmaputra in India, Hwang-He, Chang Jiang in China and the Nile in Egypt are densely populated.
- Water : As water is a basic necessity of life, human settlements always develop near sources of water. Thus, areas having an abundant supply of water are densely populated, while arid regions like deserts ate thinly populated.
- Resources : Areas that are rich in natural resources like minerals and sources of power usually support large populations. The discovery of minerals often encourages people to migrate to the site of the discovery. Such migrations took place after the discovery of goldfields in North America, Australia and South Africa.
Do Check - How, When and Where
Non Physical Factors:
Socio-economic and cultural factors influence the distribution of population. Political stability, the availability of educational and health-care facilities, and the presence of industries and employment opportunities are some of the conditions that encourage people to settle in an area. Centres of religious or cultural activity also attract people. Thus, cities like Tokyo, New York, Mumbai, Bangalore, etc., are crowded because they are centres of industry and commerce, while Varanasi is crowded because it is a centre of religion, learning and arts.

Population Change
Population Changes In The World:
- The population change refers to change in the number of people during a specific time. The world population has not been stable. It has increased manifold due to changes in the number of births and deaths. Till 1880s, the world's population grew steadily but slowly. Large numbers of babies were born, but they died early too. This was as there were no proper health facilities. Sufficient food was not available for all the people. As a result the total increase in population was very low.
- In 1820, the world's population was one billion. A hundred and fifty years later, in the early 1970s the world's population reached 3 billion. This is often called population explosion. In 1999, less than 30 years later, the population doubled to 6 billion. The main reason for this growth was that with better food supplies and medicines, deaths were reducing, while the number of births still remained fairly high.

Factors Affecting Population Change:
- There are three factors, which determine the population change - the birth rate, the death rate and migration.
The birth rate is the number of live births per thousand persons in a year. Birth rate is different from actual number of births. The birth rate was 49.2 (per thousand) in the beginning of the 20th century. This came down to 26.1 (per thousand) during the same period.
- The death rate is the number of deaths per thousand persons in a year. The death rate declined from 42.6 (per thousand) to 8.7 (per thousand). The death rate has fallen because of the success in controlling epidemics like plague, small pox, etc. This was possible because of increasing public health measures and advancement in medical technology during the last three decades.
The main cause of the high rate of growth of the Indian population is the widening gap between the birth rate and the death rate. After independence, both the birth rate and the death rate has declined but death rate has declined at a much faster rate.
- Migration is another way by which population size changes. Migration means movement of people across regions and territories. People may move within a country or between countries. Emigrants are people who leave a country; Immigrants are those who arrive in a country. Countries like the United States of America and Australia have gained in-numbers by in-migration or immigration.
Sudan is an example of a country that has experienced a loss in population numbers due to out-migration or emigration. The general trend of international migrations is from the less developed nations to the more developed nations in search of better employment opportunities. Within countries large number of people may move from the rural to urban areas in search of employment, education and health facilities.
Do Check - Ruling the Country Side
Patterns of Population Change
Rates of population greatly vary across the world. Some countries like Kenya have high population growth rates. They had both high birth rates and high death rates. Now, with improving health care, death rates have fallen, but birth rates still remain high leading to high growth rates. In other countries like United Kingdom, population growth is slowing because of both low death and !ow birth rates.
Population Composition
Population composition refers to the structure of the population. The composition of population helps us to know how - many are males or females, which age group they belong to, how educated they are and what type of occupations they are employed in, what their income levels and health conditions are.
- Sex Ratio:
Sex ratio is defined as the number of females per thousand males in the population. In our country, sex ratio has remained favourable to the males. The sex ratio in India was 933 (2001).
- Age Composition:
Age composition of population is usually expressed in terms of three broad age-groups: children below the working age (below 15 years), persons in the working age (15 to 59 years) and old person above the working age (above 59 years).
- Occupational Structure:
The occupational structure of a country refers to the distribution of its people according to different occupations. These are primary, secondary and tertiary activities. Agriculture, animal husbandry, forestry, fishery etc. are collectively known as primary activities, They are primary because, here production is carried on with the help of nature, Manufacturing industries are known as secondary activities. Transport, Cornmunication, Banking Services, etc. are called tertiary activities. There is a close relationship between development of economy and occupational structure. The higher the proportion of population in secondary and tertiary activities, the higher is level of income. Higher dependence of population on agriculture or primary activities results in lower levels of income.
- Literacy:
A person, who is able to read and write with certain understanding and is of sever, years of age and above, is called literate. The term literacy is generally related to schooling formal and non-formal. The literacy level in India was around 65.35 percent (2001). Around 75 per cent of males and 54 per cent of females are literate in our Country today.
Do Check - When People Rebel
Population Pyramid
An interesting way of studying the population composition of a country is by looking at the population pyramid, also called an age-sex pyramid.
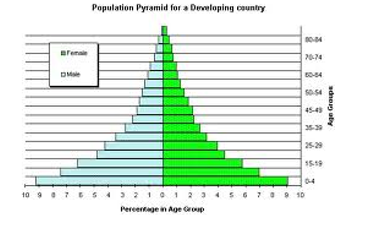
A Population Pyramid Shows:
- The shape of the population pyramid tells the story of the people living in that particular country. The numbers of chiidren (below 15 years) are shown at the bottom and reflect the level of births. The size of the top shows the numbers of aged people (above 65 years) and reflects the number of deaths. The population pyramid also tells us how many dependents are there in a country,
- The population pyramid of a country in which birth and death rates both are high is broad at the base and rapidly narrows towards the top. This is because although, many children are born, a large percentage of them die in their infancy, relatively few became adults and there are very few old people. This type of situation is found in Kenya.
- In countries where death rates (especially amongst the very young) are decreasing, the pyramid is broad in the younger age groups, because more infants survive to adulthood. Such populations contain a relatively large number of young people and which means a strong and expanding labour force. This type of situation is found in India.
- In countries like Japan, low birth rates make the pyramid narrow at the base. Decreased death rates allow numbers of people to reach ofd age.
Skilled, spirited and hopeful young people endowed with a positive outlook are the future of any nation. We in India are fortunate to have such a resource. They must be educated and provided skills and opportunities to become able and productive.
Do Check - Resources, Types And Development
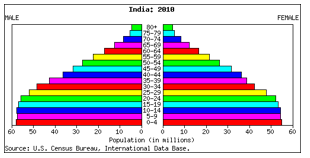
Population Pyramid Of India:
India Population Pyramid for 2010:
Age and sex distribution for the year 2010:
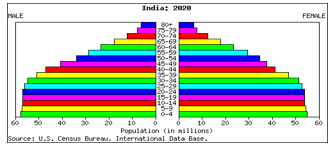
India Population Pyramid for 2020:
Predicted age and sex distribution for the year 2020:
- The Government of India has a Ministry of Human Resource Development. The Ministry was created in 1985 with an aim to improve people's skills. This just shows how important people are as a resource for the country.
- Average density of population in India is 324 persons per square km.
- Life expectancy is the number of years that an average person can expect to live. Life expectancy has risen in India from 31 years in 1951 to 64 years in 2004.
- Immigration and Emigration are two different words. Immigration: When a person enters a new country, Emigration: When a person leaves a country.
Human Resources Exercise
- Which are three main factors that cause population change ?
(A) Birth, death and marriage
(B) Birth, death and migration
(C) Birth, death and life expectancy
(D) None of the above
- More than 90% of the worlds population lives in about -
(A) 90% of land surface
(B) 8% of land surface
(C) 30% of land surface
(D) 10% of land surface
- 60% of world's people stay in -
(A) One country
(B) 2 countries
(C) 6 countries
(D) 10 countries
- High altitudinal areas are
(A) Thickly populated
(B) Moderately populated
(C) Sparsely populated
(D) Very thickly populated
- In 1999, the world population reached
(A) 1 billion
(B) 3 billion
(C) 6 billion
(D) 9 billion
- India's population ranks in the world is -
(A) 1st
(B) 2nd
(C) 5th
(D)10th
- What is a population pyramid ?
(A) A graphical presentation of the age, sex composition of a population.
(B) When the population density of an area is so high that people live in tall buildings.
(C) Pattern of population distribution in large urban areas.
(D) All of the above
- Low birth rate makes the pyramid
(A) narrow at base
(B) broad at base
(C) broad at base but narrow at the top
(D) none
- What does the term population distribution refer to ?
(A) How population in a specified area changes overtime.
(B) The number of people who die in relation to the number of people born in a specified area.
(C) The way in which people are spread across a given area.
(D) All of the above
- in countries where__________are decreasing, the pyramid is broad in the younger age groups, because more infants survive to adulthood.
(A) Birth rate
(B) Death rate
(C) Growth rate
(D) None of these
Human Resources Sujective Questions
- What is migration ?
- Which are the most crowded areas of the world ?
- What is the average density of population in India ?
- Why do people prefer to live on plains ?
- Distinguish between birth rate and death ra:e.
- What is natural growth rate ?
- Which are the two groups of dependents in a population ?
- Which type of population do the countries like Japan have ?
- What is the average density of population of the world? Which part of the world have the highest density of population ?
- What are the factors responsible for the population growth ?
- Are population composition and economic development related to each other ? Give an example in support of your answer.
- Which aspects of population do the composition of population help us to know ?
- Which type of population pyramid does India have ?
- What are the geographical factor which affects the growth of population ?
- Explain how social, cultural and economic factors affect the distribution of population ?
- Until the 1800s, the world's population grew steadily but slowly. Give reasons.
- What are the patterns of population change ?
Do Check - The Indian Constitution
Answers to Exercise
- (B)
- (D)
- (D)
- (C)
- (C)
- (B)
- (A)
- (A)
- (C)
- (B)