Population Variance
A type of variance called population variance is used to determine the variability of population data in relation to the mean. The population standard deviation is calculated by taking the square root of the population variation. It's an absolute measure of dispersion that shows how widely data in a dataset is dispersed.
Ungrouped and grouped data are the two forms of data available. The population variance can thus be calculated using two formulas. In this piece.
The distance between each data point and the population mean is determined by population variance. The average of the square of the departures from the data's mean value is known as population variance. Every observation in a finite group is referred to as a population. On the population, the population variance is calculated. When the number of observations grows large enough, a few data points are chosen to represent the entire population. These specific data points make up a sample, and the sample variance is the variance determined on this data. The population variance can be estimated using the sample variance.
Population Variance Example
Consider the following data set: 3, 7, 11. The average number is 7. To get 32, multiply the square of each data point's distance from the mean. The result is 10.67 when this value is divided by the total number of observations (3). This is the variance in the population.
Population Variance Formula
| Population Variance | |
| Ungrouped Data | 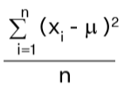 |
| Grouped Data | 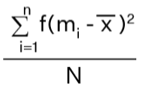 |
There are two types of data that might be encountered in statistics. Ungrouped data is the first. Ungrouped data is data that has not been organised and is still in its raw state. The second type is grouped information. Grounded data is data that has been organised into categories and presented in a systematic manner. The following are the population variance formulas for both types of data:
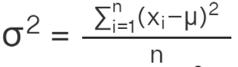
- Ungrouped Data:
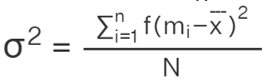
- Grouped Data:
n = total number of observations.
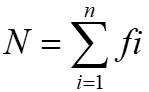
f = the frequency of occurrence of an observation for grouped data
Mean for grouped data,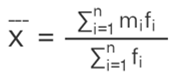
Mean for ungrouped data,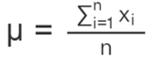
Mi = Mid-point of the ith interval.