2nd Class Mathematics Picture Graphs Question Bank
Q.1 If 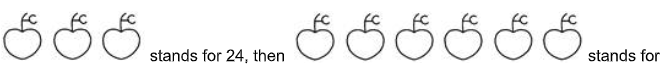
(A) 46
(B) 48
(C) 45
(D) 49
Answer:
B
Q.2 DIRECTION: The given pictograph shows the number of students in each section of class 2. Study the graph and answer the following questions.
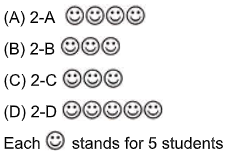
Maximum number of students are there in _______.
(A) 2 - A
(B) 2 - B
(C) 2 - C
(D) 2 - D
Answer:
D
Q.3 DIRECTION: The given pictograph shows the number of students in each section of class 2. Study the graph and answer the following questions.
Which class has the same number of students?
(A) 2 - A, 2 - B
(B) 2 - D, 2 - B
(C) 2 - C. 2 - B
(D) 2 - A, 2 - C
Answer:
C
Q.4 DIRECTION: The given pictograph shows the number of students in each section of class 2. Study the graph and answer the following questions.
How many total number of students are there in class 2?
(A) 75
(B) 70
(C) 80
(D) 85
Answer:
A
Q.5 DIRECTION: The given pictograph shows the number of necklaces beaded by 4 different girls. Study the graph and answer the following questions.
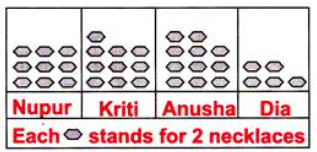
Nupur and Anusha beaded ____ necklaces altogether.
(A) 40
(B) 20
(C) 30
(D) 50
Answer:
A
Q.6 DIRECTION: The given pictograph shows the number of necklaces beaded by 4 different girls. Study the graph and answer the following questions.
Dia beaded ____ fewer necklaces than Kriti.
(A) 5
(B) 8
(C) 10
(D) 12
Answer:
C
Q.7 DIRECTION: The picture graph shows the various types of toys some boys would like for Christmas. Study the graph and answer the given questions.
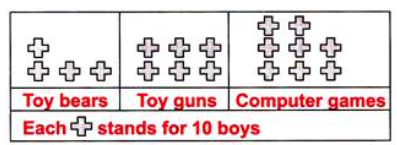
Most boys prefer ________ .
(A) Toy bears
(B) Toy guns
(C) Computer games
(D) Can't be determined
Answer:
C
Q.8 DIRECTION: The picture graph shows the various types of toys some boys would like for Christmas. Study the graph and answer the given questions.
_____ more boys prefer toy guns than toy bears.
(A) 20
(B) 30
(C) 10
(D) 15
Answer:
A
Q.9 DIRECTION: The pictograph shows the number of star stickers achieved by five children in a month. Study the graph and answer the given questions.
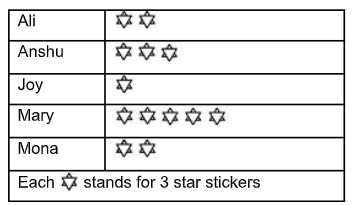
Who got minimum stars?
(A) Joy
(B) Mona
(C) Mary
(D) Anshu
Answer:
A
Q.10 DIRECTION: The pictograph shows the number of star stickers achieved by five children in a month. Study the graph and answer the given questions.
Which two children got the same number of stars?
(A) Mary and All
(B) Ali and Mona
(C) Ali and Joy
(D) Mary and Anshu
Answer:
B
Q.11 DIRECTION: The pictograph shows the number of star stickers achieved by five children in a month. Study the graph and answer the given questions.
Mary got _____ more stars than Anshu.
(A) 9
(B) 8
(C) 6
(D) 4
Answer:
C
Q.12 DIRECTION: The picture graph shows the number of refrigerators Mr Sharma sold in 4 different months. Study the graph carefully and answer the following questions.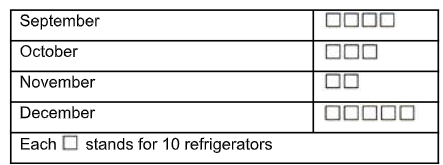
How many refrigerators did Mr. Sharma sold in October?
(A) 30
(B) 40
(C) 50
(D) 60
Answer:
A
Q.13 DIRECTION: The picture graph shows the number of refrigerators Mr Sharma sold in 4 different months. Study the graph carefully and answer the following questions.
In which month least number of refrigerators were sold?
(A) November
(B) September
(C) October
(D) December
Answer:
A
Q.14 DIRECTION: The picture graph shows the number of refrigerators Mr Sharma sold in 4 different months. Study the graph carefully and answer the following questions.
How many more refrigerators were sold in December than in November?
(A) 20
(B) 40
(C) 30
(D) 50
Answer:
C
Q.15 DIRECTION: The picture graph shows the types of colours various children prefer. Study the graph and answer the following questions.
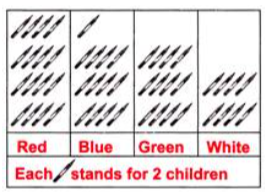
How many more children prefer red than blue colour?
(A) 14
(B) 6
(C) 4
(D) 5
Answer:
B
Q.16 DIRECTION: The picture graph shows the types of colours various children prefer. Study the graph and answer the following questions.
Which colour is least liked by children?
(A) White
(B) Blue
(C) Red
(D) Green
Answer:
A
Q.17 DIRECTION: The picture graph shows the types of colours various children prefer. Study the graph and answer the following questions.
How many children prefer green and white colour altogether?
(A) 40
(B) 20
(C) 48
(D) 34
Answer:
A
Q.18 DIRECTION: The figure shows the number of books sold by a leading book store in 4 different months. Study the graph and answer the following questions.
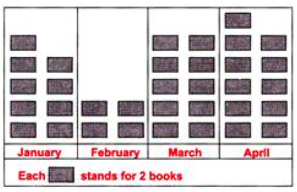
How many books were sold in four months altogether?
(A) 94
(B) 72
(C) 34
(D) 68
Answer:
D
Q.19 DIRECTION: The figure shows the number of books sold by a leading book store in 4 different months. Study the graph and answer the following questions.
How many more books were sold in January than in February?
(A) 8
(B) 26
(C) 20
(D) 10
Answer:
D
Q.20 DIRECTION: The picture graph shows the various types of collections that children prefer. Study the graph and answer the following questions.
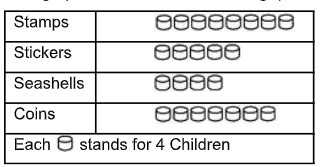
How many children prefer collecting stickers?
(A) 25
(B) 26
(C) 20
(D) 15
Answer:
C
Q.21 DIRECTION: The picture graph shows the various types of collections that children prefer. Study the graph and answer the following questions.
Which type of collection is most popular?
(A) Stamps
(B) Stickers
(C) Seashells
(D) Coins
Answer:
A