Download Free Printable Worksheet in PDF for CBSE (NCERT) Class 3 Maths with important questions with Answers
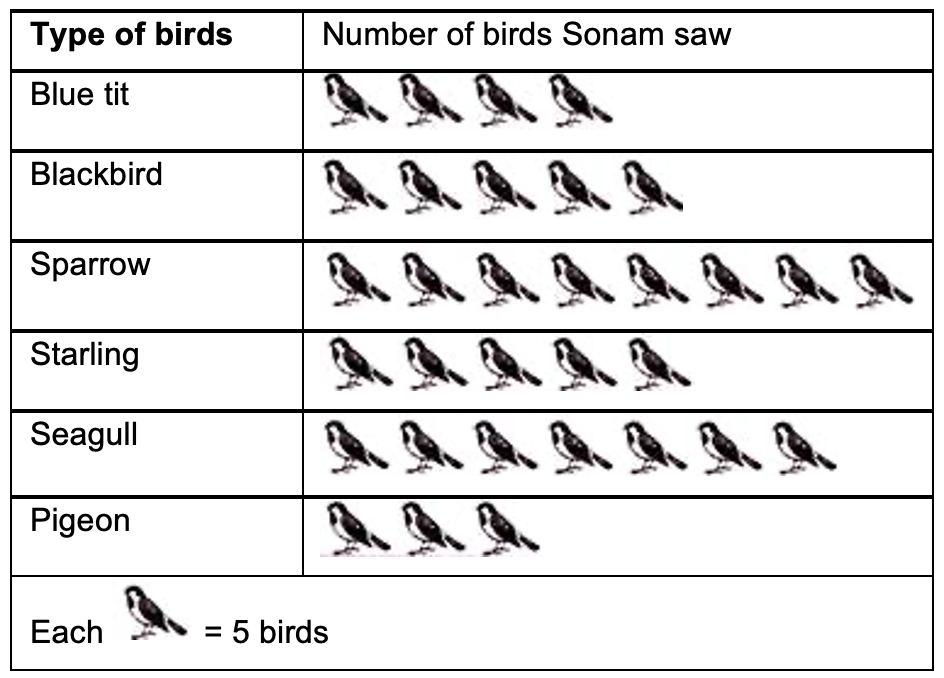
Q.1 DIRECTION: Sonam went to a bird sanctuary and saw the different types of birds. Given pictograph shows the number of birds she saw. Study the pictograph and answer the questions.
How many sparrows did Sonam saw?
(a) 35
(b) 40
(c) 50
(d) 45
Answer:
(b)
Number of sparrows seen by Sonam
=8 × 5 = 40
Q.2 DIRECTION: Sonam went to a bird sanctuary and saw the different types of birds. Given pictograph shows the number of birds she saw. Study the pictograph and answer the questions.
How many more seagulls were seen by Sonam than the blackbirds?

(a) 2
(b) 8
(c) 10
(d) 12
Answer:
(c)
Number of seagulls seen by Sonam
=7×5=35
Number of blackbirds seen by Sonam
=5 ×5 = 25
∴ Required difference
=35 − 25 = 10
Hence, 10 more seagulls than blackbirds were seen by Sonam.
Q.3 DIRECTION: Sonam went to a bird sanctuary and saw the different types of birds. Given pictograph shows the number of birds she saw. Study the pictograph and answer the questions.
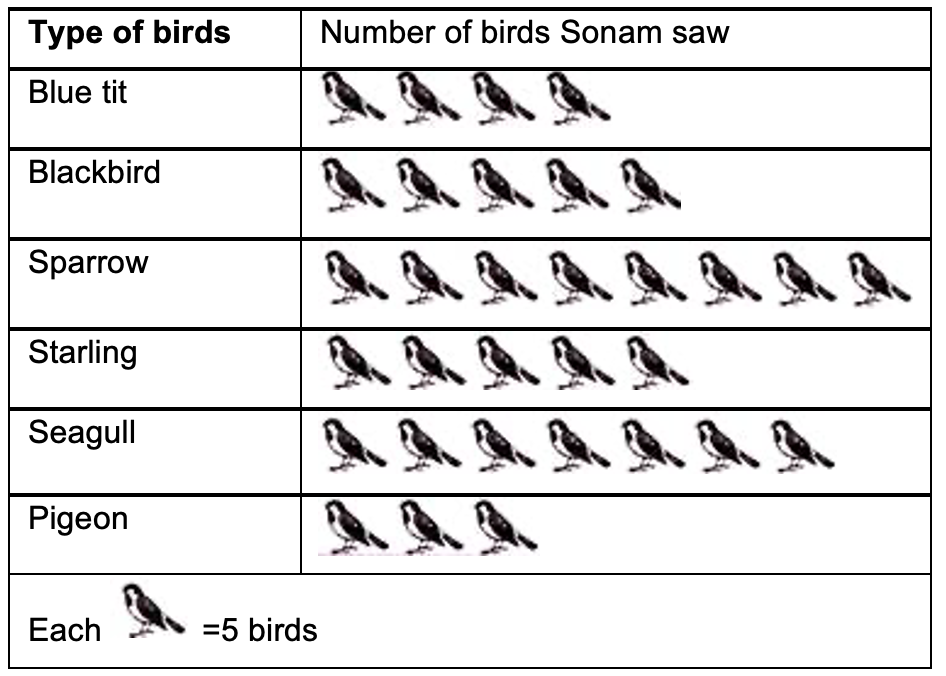
How many starlings were seen by Sonam?
(a) 5
(b) 15
(c) 20
(d) 25
Answer:
(d)
Number of starlings seen by Sonam
=5 × 5 = 25
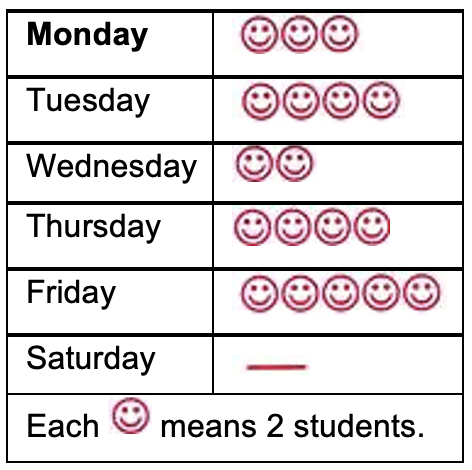
Q.4 DIRECTION (5-7): The given pictograph shows the number of students who were absent in a day of a particular week. Study the pictograph and answer the following questions.
On which day no student was absent?
(a) Saturday
(b) Friday
(c) Monday
(d) Tuesday
Answer:
(a)
On Saturday, no student was absent.
Q.5 On which day maximum number of students were absent and how many?
(a) Thursday, 10
(b) Friday, 10
(c) Monday, 10
(d) Wednesday, 10
Answer:
(b)
Maximum number of students were absent on Friday. Number of students absent on Friday
Q.6 What is the total number of students who were absent in the week?
(a) 34
(b) 36
(c) 38
(d) 33
Answer:
(b)
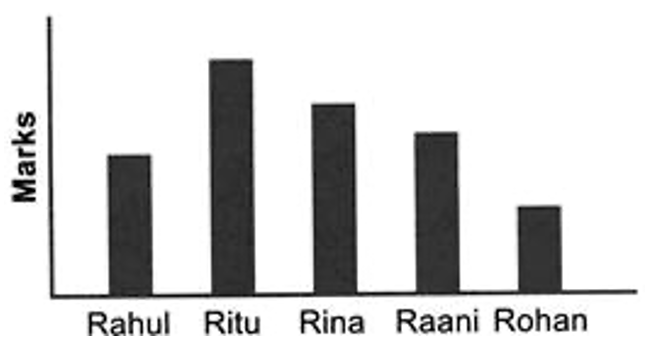
Q.7 Five friends made a graph of the number of marks they got in mathematics. Arrange the marks of the students in ascending order.
(a) Rohan, Rahul, Raani, Ritu, Rina
(b) Ritu, Raani, Rahul, Rina, Rohan
(c) Rohan, Rahul, Raani, Rina, Ritu
(d) Rahul, Raani, Rohan, Ritu, Rina
Answer:
(c)
Q.8 DIRECTION: The given bar graph shows the time taken by 6 competitors to run a 200 m race. Study the given graph and answer the following questions.Who completed the race before Ali but after Jatin?
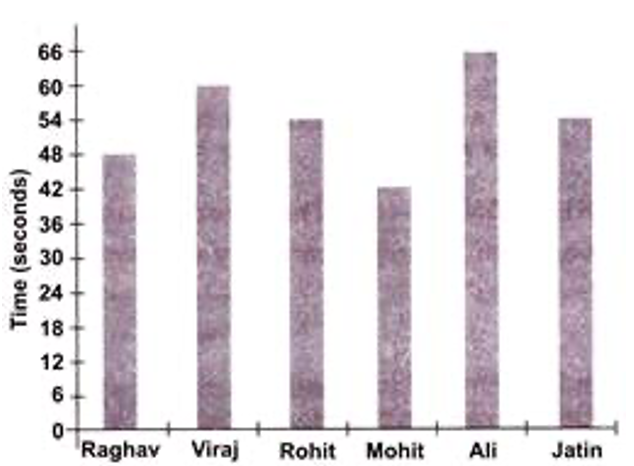
(a) Raghav
(b) Rohit
(c) Viraj
(d) Jatin
Answer:
(c)
Q.9 DIRECTION: The given bar graph shows the time taken by 6 competitors to run a 200 m race. Study the given graph and answer the following questions.Who took time more than 42 seconds but less than 50 seconds?
(a) Raghav
(b) Ali
(c) Jatin
(d) Mohit
Answer:
(a)
Q.10 What is the difference between the maximum time and minimum time taken by runners to complete the race?
(a) 22 sees
(b) 24 sees
(c) 26 sees
(d) 20 sees
Answer:
(b)
Q.11 DIRECTION: The given bar graph shows the amount of money spent by Amit in a week. Study the graph and answer the questions. How much more amount Amit spent on Thursday than on Tuesday?
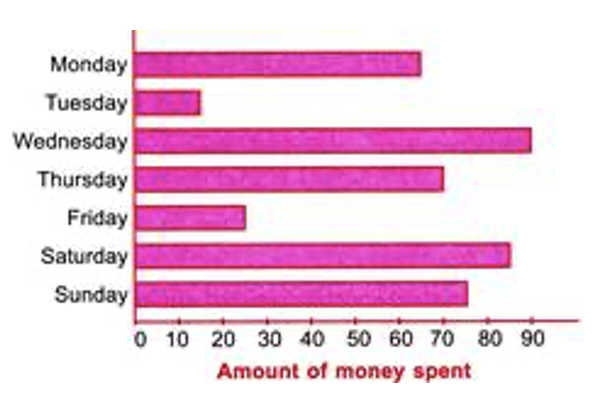
(a)Rs. 50
(b)Rs. 55
(c)Rs. 60
(d)Rs. 70
Answer:
(b)
Q.12 DIRECTION: The given bar graph shows the amount of money spent by Amit in a week. Study the graph and answer the questions. On which day Amit spent Rs. 65?
(a) Monday
(b) Thursday
(c)Saturday
(d)Wednesday
Answer:
(a)
Q.13 DIRECTION: The given bar graph shows the amount of money spent by Amit in a week. Study the graph and answer the questions.Find the amount of money spent by Amit on Sunday.
(a)Rs. 70
(b)Rs. 78
(c)Rs. 75
(d)Rs. 80
Answer:
(c)
Q.14 DIRECTION: The given bar graph shows the amount of money spent by Amit in a week. Study the graph and answer the questions.How much less Amount Amit spent on Friday than on Wednesday?
(a)Rs. 65
(b)Rs. 60
(c)Rs. 70
(d)Rs. 75
Answer:
(a)
Q.15 DIRECTION: The given graph shows the number of people who attended a book fair. Study it carefully and answer the following questions.The number of secondary school students was twice the number of________.
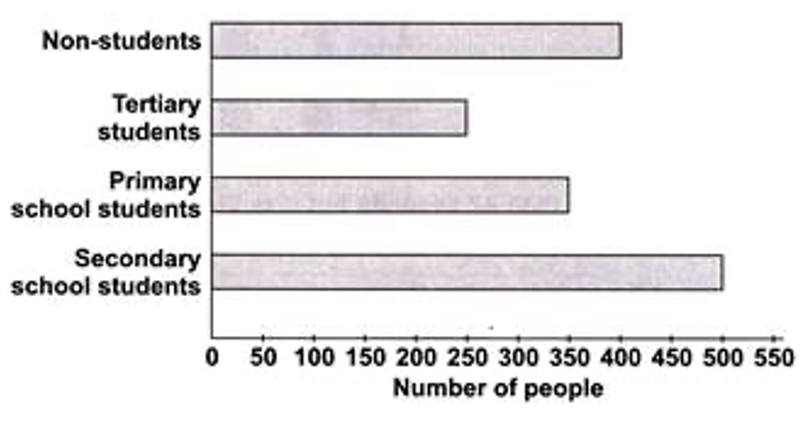
(a) Non-students
(b) Tertiary students
(c) Primary school students
(d) Can't be determined
Answer:
(b)
Q.16 DIRECTION: The given graph shows the number of people who attended a book fair. Study it carefully and answer the following questions.How many less tertiary students attended book fair than primary school students?
(a) 150
(b) 300
(c) 100
(d) 250
Answer:
(c)
Q.17 DIRECTION: The given graph shows the number of people who attended a book fair. Study it carefully and answer the following questions.Number of secondary school students are ______ more than non-students.
(a) 120
(b) 100
(c) 180
(d) 200
Answer:
(b)
Q.18 DIRECTION: The given pictograph shows the number of 4 different kinds of plants Mohit bought. Study the pictograph and answer the questions.
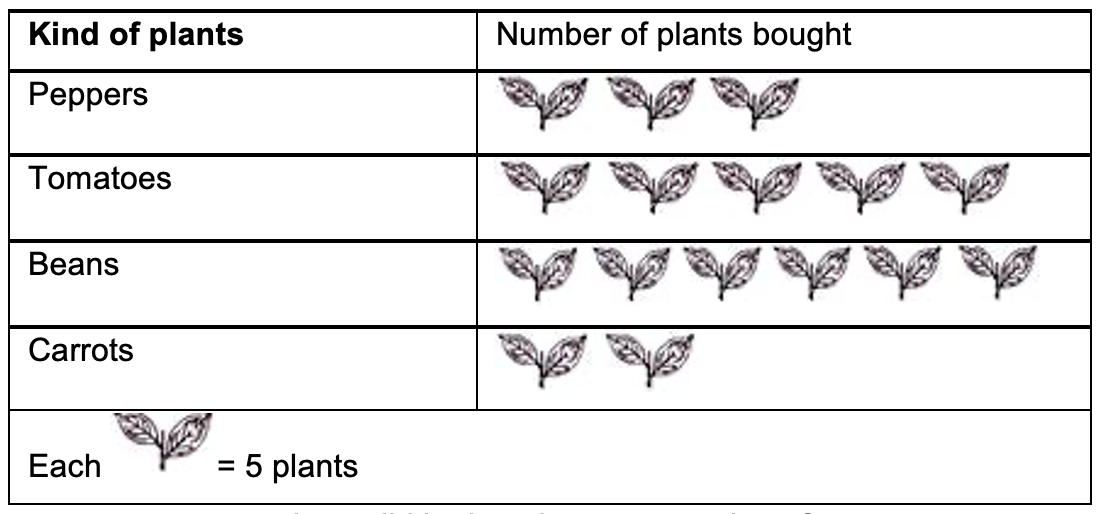
How many more tomato plants did he buy than pepper plants?
(a) 15
(b) 20
(c) 25
(d) 10
Answer:
(d)
Q.19 DIRECTION: The given pictograph shows the number of 4 different kinds of plants Mohit bought. Study the pictograph and answer the questions.
How many bean plants did he buy?
(a) 32
(b) 30
(c) 40
(d) 6
Answer:
(b)
Q.20 DIRECTION: The given pictograph shows the number of 4 different kinds of plants Mohit bought. Study the pictograph and answer the questions.
What is the total number of plants he buy?
(a) 85
(b) 80
(c) 90
(d) 75
Answer:
(b)