One of the most important objectives of statistical analysis is to get one single value that describes the characteristics of entire mass of unwieldy data Such a value is called central value or the average. It is a single value, which represents a group of values.
Classification of Data
(i) Discrete series: The observations along with their frequency of occurrence are given.
(ii) Continuous series: The class intervals along with their frequency are given.
TYPES OF AVERAGES
(a) Mean
- (i) Arithmetic Mean
- (ii) Weighted Arithmetic Mean
- (iii) Geometric Mean
- (iv) Weighted Geometric Mean
(v) Harmonic Mean - (vi) Weighted Harmonic Mean
(b) Median
(c) Mode
Arithmetic Mean
The arithmetic mean of a statistical data is defined as the quotient of the sum of all the values of the variable by the total number of items. It is denoted by A.M.
For an individual series
(a) A.M. = .png)
(b) If each observation is increased or decreased by a constant A, then the mean also increases or decreases and is given as follows:
If x1, x2 …. xn are given data with mean x̄ and we take di = xi - A, then the new mean X of the new data d1, d2 … dn is given as
.png)
For a frequency distribution,
(a) A.M = .png) (Mean of grouped data)
(Mean of grouped data)
(b) Short-cut Method:
A.M. = A + .png) , where di = xi – A.
, where di = xi – A.
To simplify calculation, A can be taken as any number.
(c) Step Deviation Method: If x1, x2, ….. xn are mid values of class intervals with corresponding frequencies f1, f2, …. fn , then mean can be calculated as :
A.M. = A +  h and ui =
  .
.
A and h can be any numbers but if the lengths of class intervals are equal, then h can be taken as width of the class interval.
Weighted Arithmetic Mean:
If w1, w2, w3, …, wn are the weights assigned to the values x1, x2, x3, …, xn respectively, then the weighted average is defined as:
Weighted Arithmetic Mean = 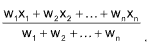
Ex.: A group of 10 items has mean 6. If the mean of 4 of these items is 7.5, then the mean of remaining items is
(A) 6.5
(B) 5.5
(C) 4.5
(D) 5.0
Solution: (D).
Sum of all the 10 items = 10 x 6 = 60
Sum of four of these items 4 x 7.5 = 30
∴ sum of the remaining six items = 60 –30 = 30.
Hence, the mean of remaining six items = 30/6 = 5
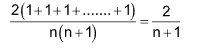
Ex.: If the values 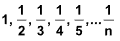 occur at frequencies 1, 2, 3, 4, 5,……., n in a distribution, then the mean is
(A) 1
(B) n
(C) 1/n
(D) 2/n + 1
Solution: (D). Mean = 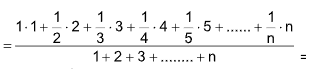
Median:
Medianis defined as the middle most or the central value of the variables in a set of observations, when the observations are arranged either in ascending or in descending order of their magnitudes. It divides the arranged series in two equal parts. Median is a position average, whereas, the arithmetic mean is the calculated average. When a series consists of an even number of terms, median is the arithmetic mean of the two central items. It is generally denoted by M.
Case I: When n is odd.
In this case  th value is the median i.e.
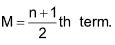
Case II: When n is even.
In this case there are two middle terms 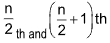 . The median is the average of those two terms, i.e.
 .png) th term and
th term and .png) term.
term.
Case III: When the series is continuous.
In this case the data is given in the form of a frequency table with class–interval, etc., and the following formula is used to calculate the Median.
M = L +  , where
L = lower limit of the class in which the median lies
n = total number of frequencies, i.e., n = ∑f.
f = frequency of the class in which the median lies
C = cumulative frequency of the class preceding the median class
i = width of the class in which the median lies.
Quartile:
Just as the median divides a set of observations (when arranged in ascending or descending order of magnitudes), into two equal parts, similarly, the quartile divides the observations into four equal parts. The value of the item midway, between the first item and the median is known as first or lower quartile and is denoted be Q1. The value of the item midway between the last item and the median is known as Third or Upper Quartile and is denoted Q3. The median is known as the Second Quartile and denoted by Q2.
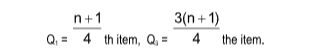
Case I: For ungrouped data.
Case II: For a frequency distribution
Q1 = 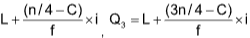 , where
L = lower limit of the class in which a particular quartile lies,
f = Frequency of the class-interval in which a particular quartile lies
i = Width of the class in which a particular quartile lies,
C = Cumulative frequency of the class preceding the class in which the particular quartile lies
In general, Qh = L + 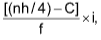 h = 1, 2, 3, 4
Mode:
Mode is defined as that value in a series which occurs most frequently. In a frequency distribution, mode is that variate which has the maximum frequency.
Continuous Frequency Distribution:
i) Modal Class: It is that class in a grouped frequency distribution in which the mode lies.
Mode = 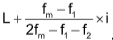 , where
L = the lower limit of the modal class
i = the width of the modal class
f1 = frequency of the class preceding the modal class
fm = frequency of the modal class
f2 = frequency of the class succeeding the modal class.
Sometimes it so happens that the above formula fails to give the mode. In this case, the modal value lies in a class other than the one containing maximum frequency. In such cases we take the help of the following formula:
Mode = .png) , where L, f1, f2, i have usual meanings.
, where L, f1, f2, i have usual meanings.
Asymmetrical Distribution:
A distribution in which mean, median and mode coincide is called symmetrical distribution. If the distribution is moderately asymmetrical, then mean, median and mode are connected by the formula.
Mode = 3 Median – 2Mean
Ex.: The mode of 0, 1, 6, 7, 2, 3, 7, 6, 6, 2, 6, 0, 5, 6, 0 is
(A) 0
(B) 5
(C) 6
(D) 2
Solution: (C).
Maximum frequency = 5 of number 6.
Mode = 6
Ex.: In a moderately skewed distribution the values of mean and median are 5 and 6 respectively. The value of mode in such a situation is equal to
(A) 8
(B) 11
(C) 6
(D) none of these
Solution: (A).
Since mode = 3 median – 2 mean = 3(6) – 2(5) = 8
Geometric Mean
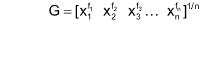
If x1, x2, x3, … xn are n values of a variable x, none of them being zero, then the Geometric mean G is defined as G = (x1 x2 x3 … xn )1/n.
Geometric Mean for Frequency Distribution:
Geometric mean of n values x1, x2, x3, …, xn of a variable x, occurring with frequency f1, f2, f3, …, fn respectively is given by
 or G = antilog
  , n = ∑fi
Harmonic Mean:
The harmonic mean of n items x1, x2, x3,…, xn is defined as:
Harmonic Mean = 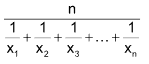
Harmonic Mean of Frequency Distribution:
Let x1, x2, x3, …, xn be n items which occur with frequencies f1, f2, f3, …, fn respectively. Then their Harmonic Mean is given by
Harmonic Mean = 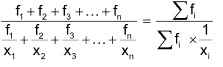
Relation among Arithmetic Mean, Geometric Mean and Harmonic Mean:
The Arithmetic Mean (A. M.), Geometric Mean (G.M.) and Harmonic Mean (H.M.) for a given set of observations x1, x2, x3 ……xn > 0 of a series are related as under:
A. M ≥ G.M ≥ H.M
Example 5 : The harmonic mean of 4, 8, 16 is
(A) 6.4 (B) 6.7
(C) 6.85 (D) 7.8
Solution: (C). H.M. of 4, 8, 16  = 6.85.
MEASURES OF DISPERSION
Dispersion means scatterness. The degree to which the numerical data tend to spread about an average value is called the dispersion of the data. There are four measures of dispersion.
Range:
Range is the difference between the largest and the smallest observation.
∴ Range = L – S, where L = largest value; S = smallest value.
Quartile Deviation:
Quartile deviation = 
Mean Deviation:
It is the average of the modulus of the deviations of the observations in a series taken from any
point A.
Methods for Calculation of Mean Deviation:
Case I: For Ungrouped Data x1, x2,… xn
In this case the mean deviation is given by the formula:
Mean Deviation = M.D. =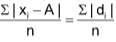 ,
,
where ‘di’ stands for the deviation of xi from the point A and |di| is always positive and n is the total number of items.
Case II: For Grouped data.
Let x1, x2, x3, …, xn occur with frequencies f1, f2, f3, ,… fn respectively, then the mean deviation is given by the formula.
Mean Deviation = 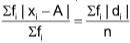 , where di = |xi – A| and ∑fi = n.
Here A can be the mean or the median of the observations. Mean deviation is least when taken from the median.
Standard Deviation:
The Positive square root of the average of squared deviations of all observations taken from their mean is called standard deviation. It is generally denoted by the Greek alphabet or s.
Variance:
The square of the standard deviation is called variance and is denoted by 2.
Standard Deviation for Ungrouped Data:
Direct method:
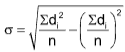
In case of individual series, the standard deviation can be obtained by the formula:
where di = xi ⎯ x̄ and xi = value of the variable or observation, x̄ = arithmetic mean, n = total number of observations.
Short-cut Method:
This method is applied to calculate standard deviation, when the mean of the data comes out to be a fraction. In that case it is very difficult and tedious to find the deviations of all observations from the mean by the earlier method. The formula used is
 where di = xi – A, A = assumed mean, n = total number of observations.
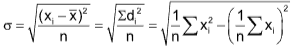
Standard Deviation for Grouped Data:
It is calculated by the following formula.
where x̄ is A.M., xi is the size of the item, fi is the corresponding frequency in the case of discrete series and N = ∑fi.
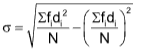
But when the mean has a fractional value, then the following formula is applied to calculate S.D. :
where di = xi – A, A = assumed mean, N = ∑fi.
Standard Deviation in Continuous Series:
Direct Method. The standard deviation in the case of continuous series is obtained by the following formula:
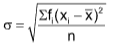
where xi = mid-value, x̄ = A.M., fi = frequency, n = total frequency.
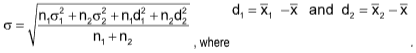
Combined Standard Deviation:
Let σ1 and σ2 be the S.D. of the two groups containing n1 and n2 items respectively. Let x̄1 and x̄2 be their respective
A.M. Let x and σ be the A.M. and S.D. of the combined group respectively. Then .
Variance
Variance =  , or Variance = σ2 ⸫ σ =
Note: Variance of first n natural numbers is (n2 –1)/12.
Example 6 : The S.D of 7 scores 1, 2, 3, 4, 5, 6, 7 is
(A) 4 (B) 2
(C)  (D) none of these
Solution: (B). S.D of first n natural number is 
For n = 7 this value = 
Coefficients of dispersion
(i) Coefficient of Range =  where L = largest value; S = smallest value.
(ii) Coefficient of Quartile Deviation =  where Q1 is the first quartile and Q3 is the third quartile.
(iii) Coefficient of Mean Deviation =  (where A is the point from which deviations are calculated).
(iv) Coefficient of Standard Deviation =  where σ is the standard deviation and x̄ is the A.M. of the observations.
(v) Coefficient of variation =  where S.D. is the standard deviation.
ANSWER TO EXCERCISE
Exercise 1. i) C
ii) A
iii) C
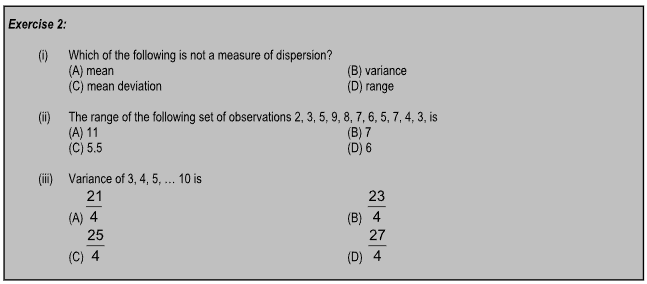
Exercise 2. (i) A
(ii) B
(iii) A
FORMULAE AND CONCEPTS AT A GLANCE
1. A.M. = .png)
2. A.M =  (Mean of grouped data)
3. Weighted Arithmetic Mean = .png) .
.
4. When n is odd.  In this case
 .png) th value is the median i.e.
th value is the median i.e.
5. When n is even in this case there are two middle terms .png) th and
th and.png) . The median is the average of those two terms, i.e.
. The median is the average of those two terms, i.e. .png) th term and
th term and .png) term.
term.
6. If x1, x2, x3, … xn are n values of a variable x, none of them being zero, then the Geometric mean G is defined as G = (x1 x2 x3 … xn )1/n.
7. Harmonic Mean = .png)
8. Variance = .png) , or Variance = σ2
, or Variance = σ2
SOLVED EXAMPLES
1. The mean deviation about the median of the series of batsman in ten innings 34, 38, 42, 44, 46, 48, 54, 55, 56, 76 is
(A) 12.9 (B) 7.6
(C) 8 (D) none of these
Sol. (A). The data is : 34, 38, 42, 44, 46, 48, 54, 55, 56, 76.
Median = the mean of 5th and 6th term = .png)
Now xi’s ≥ M are 48, 54, 55, 56, 76 ; xi’s < M are 34, 38, 42, 44, 46 ⸫ n1 = 5 and n2 = 5
⸫ s1 = 48 + 54 + 55 + 56 + 76 = 289 s2 = 34 + 38 + 42 + 46 = 160.
Mean deviation = 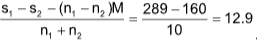 .
.
2. S.D of a data is 6. When each observation is increased by 1, then the S.D of new data is
(A) 5 (B) 7
(C) 6 (D) 8
Sol. S.D (and variance) of a data is not changed when each observation is increased (or decreased) by the same constant.
3. If a variable takes the discrete values α + 4, α – 7/2, α – 5/2, α – 3, α – 2, α + 1/2, α –1/2,
α + 5, (α > 0), then the median is
(A) α – 5/4 (B) α – 1/2
(C) α – 2 (D) α + 5/4
Sol. (A). Arranging the data, we have α – 7/2, α – 3, α – 5/2, α – 2, α – 1/2, α + 1/2, α + 4, α + 5
Median is 1/2(4th observation + 5th observation) = 1/2(α –2 + α –1/2) = α – 5/4.
4. If in a moderately asymmetrical distribution, mode and mean of the data are 6λ and 9λ respectively, then median is
(A) 8λ (B) 7λ
(C) 6λ (D) 5λ
Sol. (A). 6λ = 3median –2 x 9λ ⇒ 3 median = 24λ ⇒ median = 8λ.
5. The mean of the binomial co-efficients in the expansion of (1 + x)n is
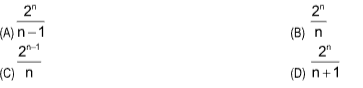
Sol. (D). Mean = 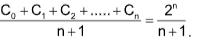
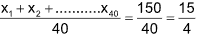
6. The number of observations in a group is 40. If the average of first 10 is 4.5 and that of the remaining 30 is 3.5, then the average of the whole group is
(A) 4 (B) 
(C)  (D) none of these
Sol. (C).  ;And
;And
⸫ 
7. A student obtains 75%, 80% and 85% in three subjects. If the marks of another subject are added, then the minimum average marks are (max. marks of each subject : 100)
(A) 50% (B) 60%
(C) 70% (D) 80%
Sol. (B). Marks obtained from 3 subjects out of 300 = 75 + 80 + 85
i.e. = 240
If the marks of another subject are added, then the marks will be ≥ 240 out of 400.
Minimum average marks =  .
.
8. In a group of students, mean weight of boys is 80 kg and mean weight of girls is 50 kg. If the mean weight of all the students taken together is 60 kg, then the ratio of number of boys to that of girls is
(A) 2 : 1 (B) 1 : 2
(C) 2 : 3 (D) none of these
Sol. (B). Let the number of boys be n1 and that of girls be n2, then
60 =  ⇒60n1 + 60n2 = 80n1 + 50n2 ;⇒ 10n2 = 20n1 ⇒ n1 : n2 :: 1 : 2.
9. The sum of squares of deviations for 10 items from the mean (= 50) is 250. The coefficient of variation is
(A) 25 (B) 50
(C) 10 (D) none of these
Sol. (C). S.D (σ) =  = 5 ⸫coefficient of variation =
 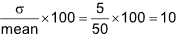 .
.
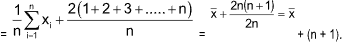
10. The mean of the set of numbers x1, x2, x3, ... xn is , then the mean of the numbers xi + 2i,
1 ≤ i ≤ n, is
(A) x̄ + 2n (B) x̄ + (n + 1)
(C) x̄ + 2 (D) none of these
Sol. (B). 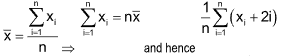
ASSIGNMENT
1. The number of children in 25 families of a locality are recorded as follows:
3, 1, 4, 0, 2, 1, 1, 2, 3, 3, 2, 2, 2, 5, 0, 1, 4, 1, 2, 1, 2, 3, 0, 1, 4.
Then mean number of children per family is
(A) 2 (B) 3
(C) 4 (D) 5
2. The mean of 12 numbers is 24. If 5 is added in every number, the new mean is
(A) 25 (B) 29
(C) 84 (D) none of these
3. If the arithmetic mean of two numbers is 10 and their geometric mean is 8, their harmonic mean is
(A) 6.2 (B) 6.4
(C) 6.3 (D) 5.4
4. The points scored by basket ball team in a series of matches are as follows:
15, 3, 8, 10, 22, 5, 27, 11, 12, 19, 18, 21, 13, 14. Its median is
(A) 13 (B) 13.4
(C) 13.5 (D) 14.5
5. If fi/xi is the frequency distribution then the algebraic sum of deviations of a set of values from their AM is
(A) 1 (B) 0
(C) ∞ (D) none of these
6. If mean of the n observations x1, x2, ……, xn be x̄, then the mean of n observations 2x1 + 3, 2x2 + 3, ….., 2xn + 3 is
(A) 3x̄ + 2 (B) 2x̄ + 3
(C) x̄ + 3 (D) 2x̄
7. Average rainfall of Ranchi from Monday to Saturday is 0.3 inches. Due to heavy rainfall on Sunday, the average rainfall for the week increased to 0.5 inches. What was the rainfall on Sunday?
(A) 1.8 (B) 1.7
(C) 1.6 (D) none of these
8 The mean marks of 120 students is 20. It was later discovered that two marks were wrongly taken as 50 and 80 instead of 15 and 18. The correct mean of marks is
(A) 19.19 (B) 19.17
(C) 19.21 (D) 19.14
9. The coefficient of range of the weights of 10 students from the following data:
41, 20, 15, 65, 73, 84, 53, 35, 71, 55 is
(A) 0.696 (B) 0.69
(C) 0.686 (D) none of these
10. If the first quartile is 104 and quartile deviation is 8, then the third quartile is
(A) 130 (B) 120
(C) 136 (D) 146
11. A person’s monthly earning for a year in Rupees are 139, 150, 151, 151, 157, 158, 160, 161, 162, 162, 173, 175. The coefficient of range for his earnings is
(A) 0.115 (B) 0.215
(C) 0.315 (D) 1.15
12. You are provided with the following raw data of two variables x and y.
∑x = 235, ∑y = 250, ∑x2 = 6750, ∑y2 = 6840.
Ten pairs of values are included in the survey. The standard deviations are
(A) 11.08, 7.68 (B) 11.02, 7.58
(C) 11.48, 7.48 (D) none of these
13. The coefficient of variation of a series is 50. Its S.D. is 21.2. Its arithmetic mean is
(A) 42.4 (B) 22.6
(C) 26.6 (D) 36.1
14. If S.D. of a set of observations is 4 and if each of the observation is divided by 4, then the S.D. of new set of observations is
(A) 4 (B) 3
(C) 2 (D) 1
15. The G.M. of 4, 5, 20, 25 is
(A) 10 (B) 20
(C) 100 (D) none of these
ANSWER TO ASSIGNMENT PROBLEMS
1. A 2. B 3. B
4. C 5. B 6. B
7. B 8. B 9. A
10. B 11. A 12. A
13. A 14. D 15. A